OncoJS
Analyze & Discover
Bring data to life with stunning visualizations and real-time analysis.
A picture is worth a thousand data points, so we created OncoJS to help see the science! Interactive and beautifully styled components that complete real-time analysis can bring your visualizations to the next level.
 Get Started
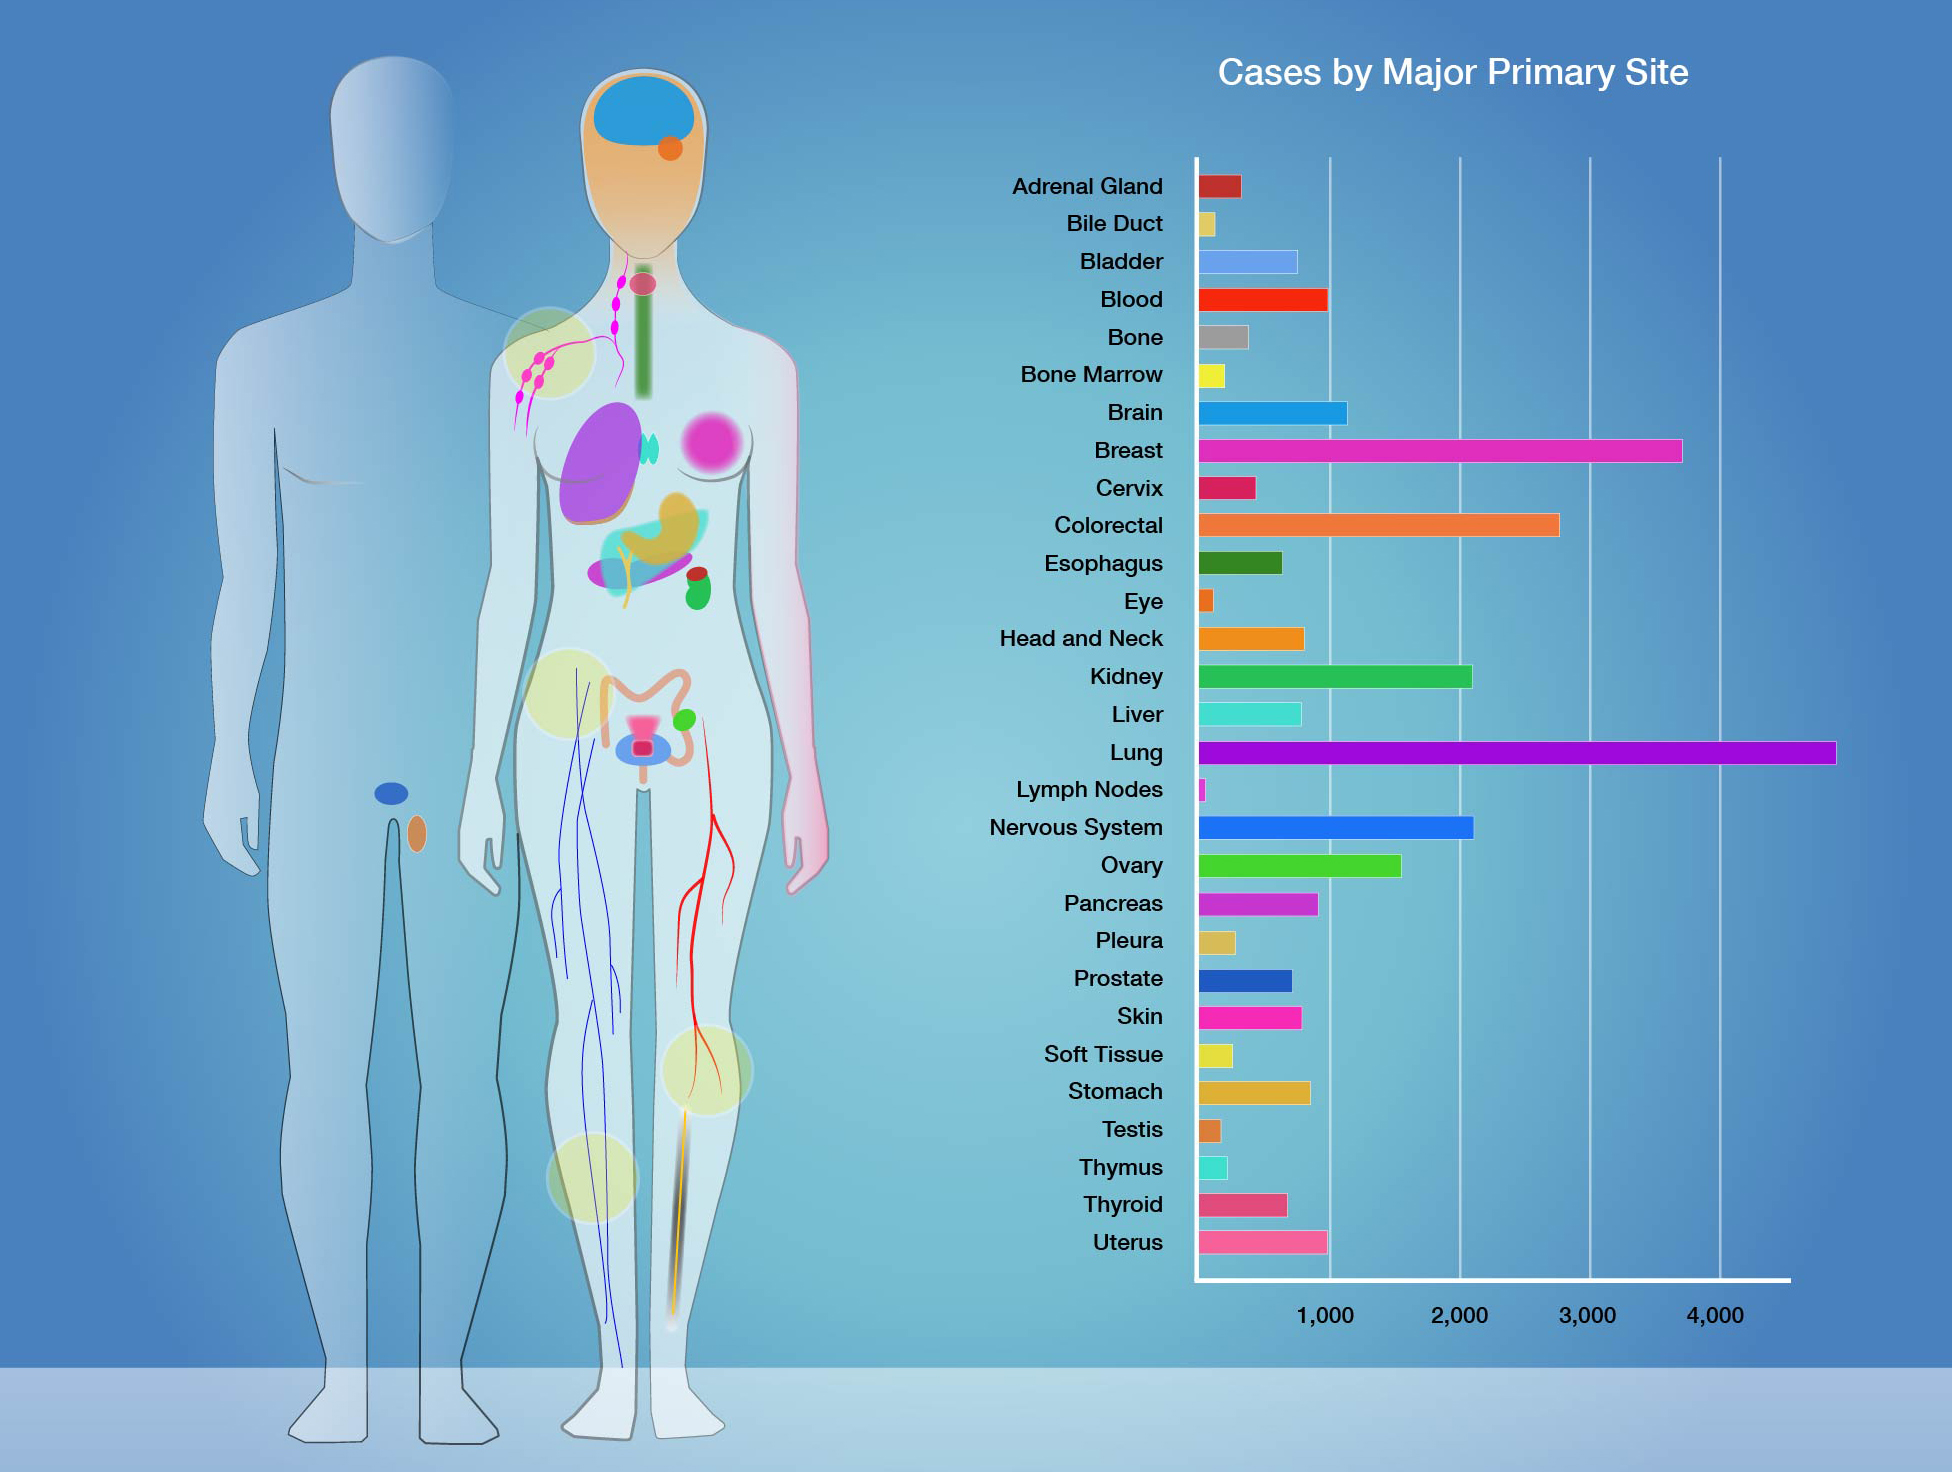
Sapien
Correlate data to an interactive map of the human body.

Provide an opportunity for your users to learn and explore data visually.
Deliver an interactive experience for users to consume key information and data.


Lollipop
Visualize the location of mutations on a protein structure.
Lollipop height is based on cohort frequency.
Zoom in/out of protein domains.
Pass in a d3 object (v3 or v4) to generate your plot.
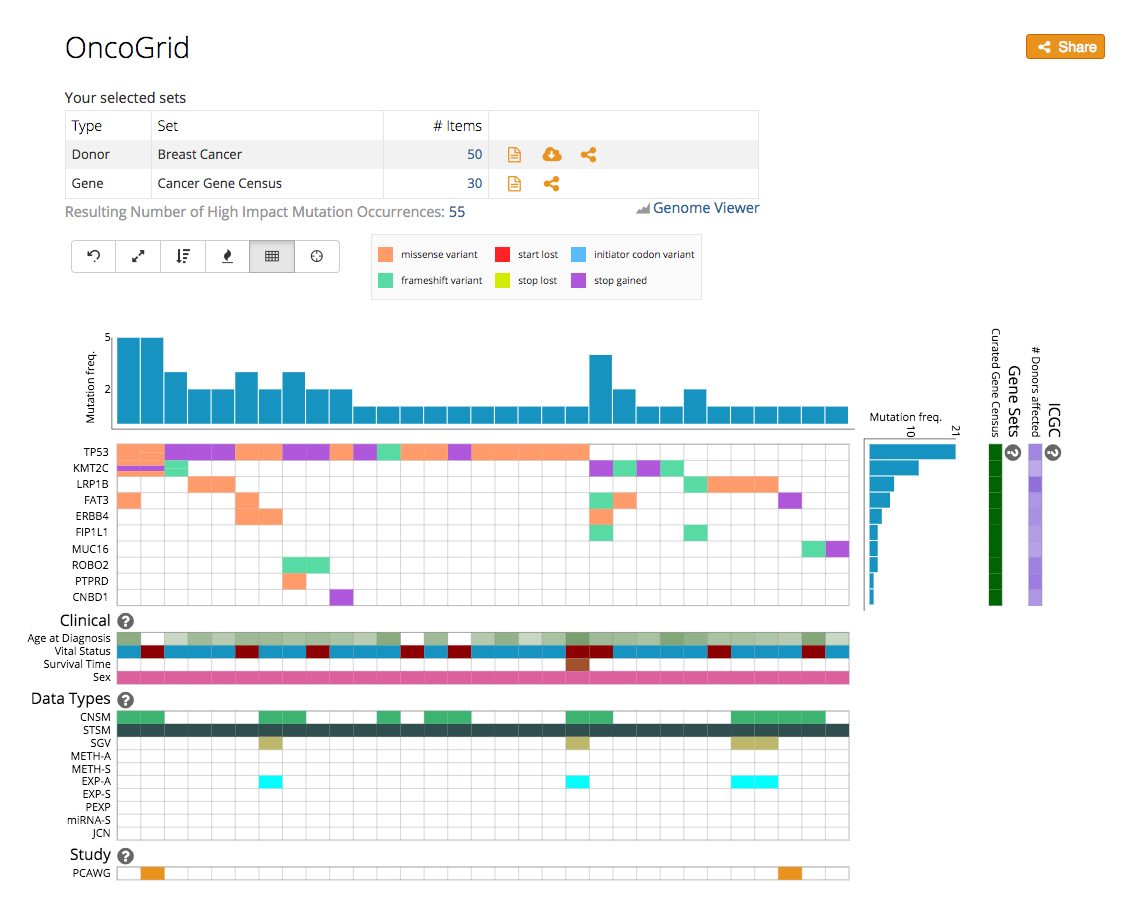
Oncogrid
Identify trends in mutation co-occurrence by plotting mutations and donors together on an Oncogrid.
Customize your grid by plotting clinical data tracks along the same axis.
Interactively explore mutation trends with heat-map view and scrolling.
Get started easily with examples in API documents.
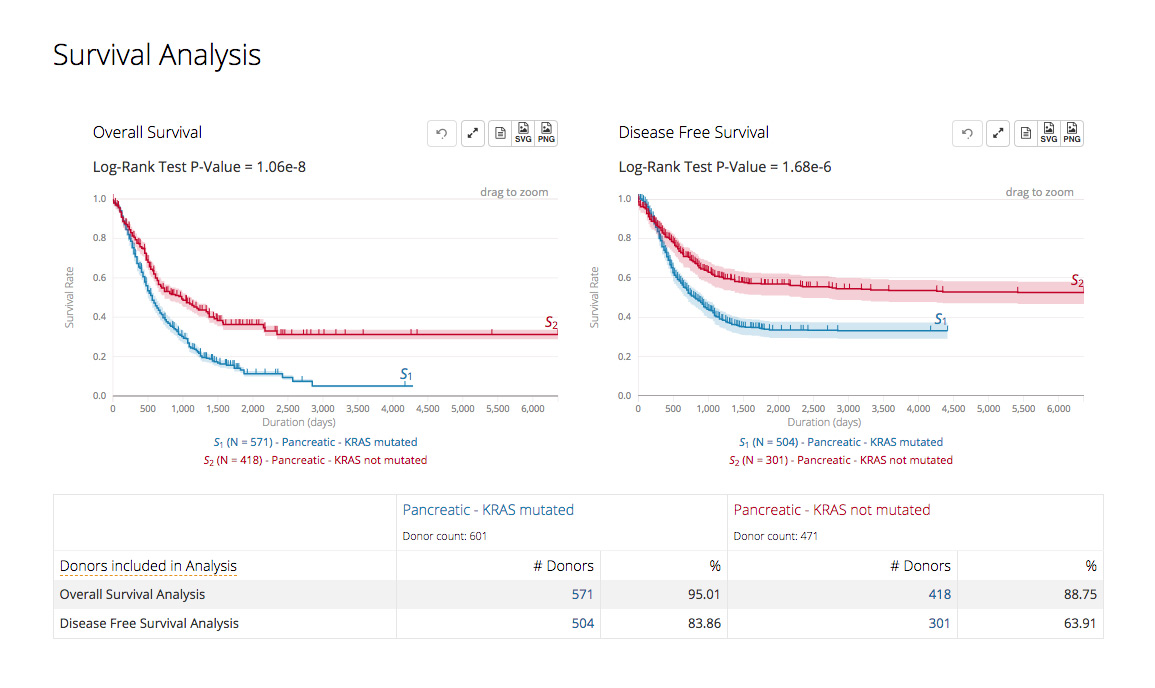
Survivalplot
Visualize and compare datasets to determine probable health outcomes and their frequency in patient groups.
View summary data and observe survival patterns over time.
Compare different patterns and trends using expansive datasets.
Easily download summaries and graphs for 360 degree analysis.
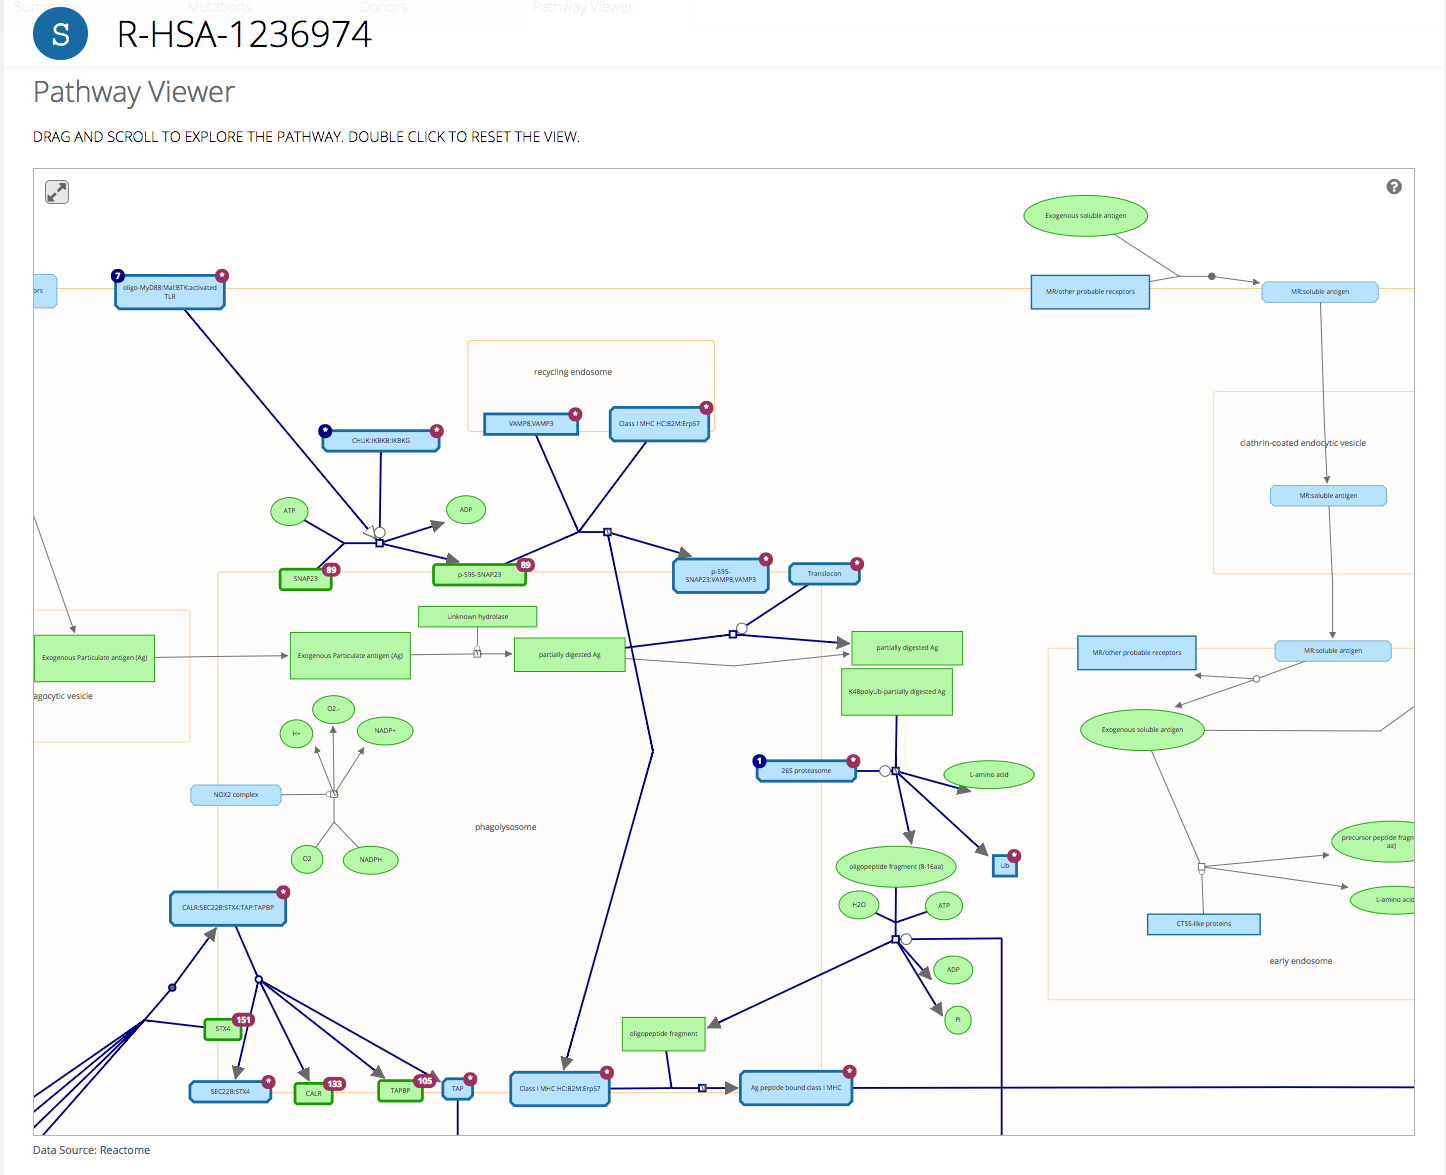
Pathwayviewer
A straightforward component for visualization of reactome pathways.
See the biology: visualize reactome data in a quick and easy way.
Explore your data: understand pathways and predict their implications.
View and synthesize data in the context of different pathways.